- Home
- Education
- Publications
- Presentations
- Paper
Energy trade
Countries and regions have different demands for energy, and different energy resources. Trading energy between regions can reduce economic and environmental costs. The EneTrade model's initial development was with an emphasis on electricity. Long distance electricity exchanges will enhance the economic utilisation of renewable electricity sources that are variable temporally and geographically.
The EneTrade model minimises the global avoidable costs of trading across an energy system. An energy system basically consists of a set of locations, usually countries, at each of which there is an energy demand and a set of energy sources with different marginal prices. Storage is not presently accounted for in the model. Energy is traded between locations, constrained by the capacity of the links between locations. The model minimises the total avoidable cost of meeting the energy demands for a given time period such as an hour or a month. The trade model is primarily designed for electricity trading, but it could be used for other fuels, such as gas, or for non-energy commodities.
Optimisation utilises a combination of methods: downhill stepping, genetic algorithms and randomisation. These methods are slower than linear programming, but can deal with non-linear aspects of systems. For example: the transmission efficiency of grid links varies non-linearly with flow; fuel prices vary non-linearly with volume. Non-financial costs, such as a pollution emission penalty for SO2 or CO2, can be added to the marginal costs, to include other parameters into the optimisation.
A video of the model in operation can be downloaded here (0.7Mb, AVI WMV9) or here (0.3 Mb, gif).
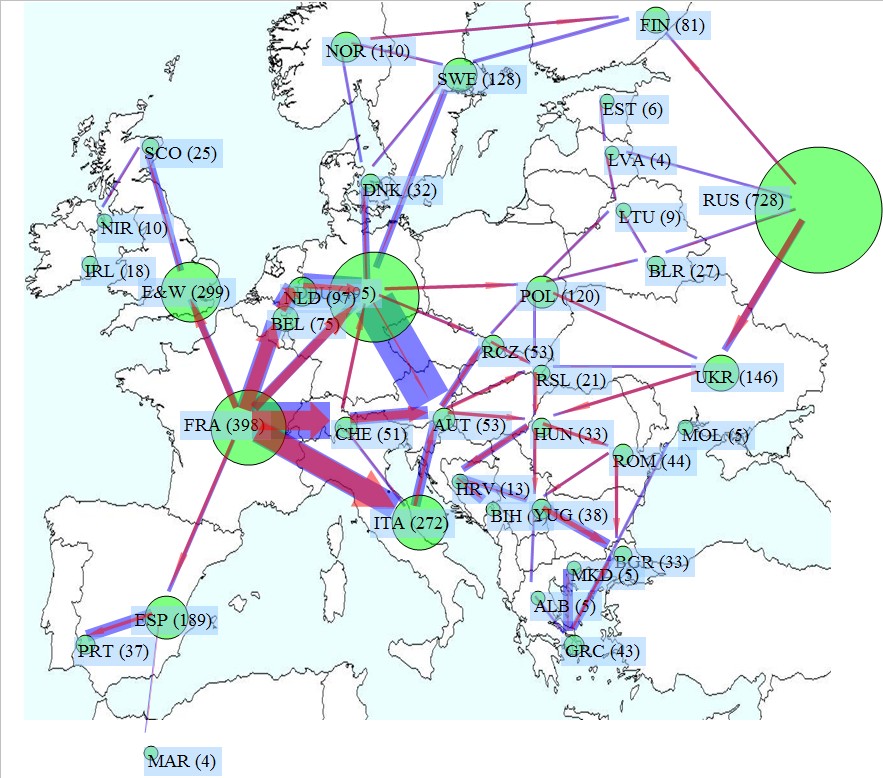
The model provides graphical and tabular output. Sample results for 37 European countries are given below using dummy data. The map below shows, for one period, domestic demands (green circles with annual demand in TWh), link capacities (blue rectangles) and flows (red arrows).
The chart below shows domestic demand, net generating requirement, net trade (as columns) and minimum marginal export costs (red line) for each location. The optimisation reduces the differences between the marginal export costs; it flattens the red line.